THIS CERTIFICATION IS AUTHENTIC AND ACCEPTED BY EMPLOYERS. HOW ? Read more
What You get
with this Course
Comprehensive Tableau I Data Science Course I Certification I Training

WHY IS THIS VIDEO TRAINING ONLINE CERTIFICATION HIGH IN DEMAND?
Brainmeasures Comprehensive Tableau with Data Science Course and Training
What you will learn?
Learn to Install Tableau Desktop
Link Tableau to a variety of datasets: CSV and Excel files
Make bar charts.
Publish area charts
Make maps
Publish scatterplots
Make pie charts.
Build treemaps
Establish interactive dashboards
Establish storylines
Know the various types of joins and how they operate.
Utilize Tableau's Data Blending feature.
Make calculations in tables
Utilize parameters
Make dual-axes charts.
Construct Calculated Fields
In a blend, add calculated fields.
Export Tableau results to Word, PowerPoint, and other programs
Utilize Time-series Data (two approaches)
Making Tableau Data Extracts
Recognize the Level of Detail, Granularity, and Aggregation
Filtering by adding quick filters
Establish Data Hierarchies
Adding actions (filters and highlighting) to dashboards
Making Data Elements Geographically Responsible
Brainmeasures tableau with data science video course has been developed to help interested candidates gain knowledge of data visualization. Tableau enhances your ability to make better decisions using data patterns like customer purchasing patterns, sales trends, or manufacturing bottlenecks.
Tableau with Data Science
Tableau is a powerful tool for visualizing and analyzing data, but did you know that it can also integrate with data science? By combining Tableau with data science techniques, you can gain deeper insights and make more informed decisions. Brainmeasures Tableau with data science course will help you understand how Tableau integrates with data science. Throughout the course, you will get examples ranging from predicting customer churn to analyzing social media sentiment and will showcase how combining these two tools can lead to better insights and outcomes. Whether you are a data scientist looking to enhance your visualizations or a Tableau user interested in exploring data science, this is an ideal course.
So let's dive in enroll in this course and see how Tableau can unlock the power of data science!
Introduction to Tableau & Data Science
Tableau is an essential tool in the world of data science. It's user-friendly interface and intuitive design allow users to effectively analyze complex data sets and communicate insights with ease. Learning Tableau basics can be a game-changer for any professional looking to leverage data for decision-making. With Tableau, users can create stunning visualizations, charts, and dashboards that paint a clear picture of the data. It enables users to explore relationships between different variables and identify patterns that may be hidden in the data. With its powerful capabilities, Tableau can help organizations make informed decisions based on actionable insights. In summary, Tableau is an indispensable tool for anyone looking to dive deep into data analysis and gain meaningful insights.
Tableau and Data Science are two fields that go hand in hand. As we all know, Data Science is an interdisciplinary field that highly relies on data to gain insights into complex problems. On the other hand, Tableau is a powerful data visualization tool that helps in displaying and interpreting complex data in a simplified manner. With Tableau, you can learn data visualization through interactive and intuitive graphics, making it easier to understand and make decisions based on data. By using Tableau, you can visualize complex data sets and present them in an understandable format, which is an essential skill for any Data Scientist.
Furthermore, for individuals seeking to become proficient in both Tableau and data science, pursuing the Brainmeasures Tableau data science video course and certification is advantageous. Not only does this certification provide an in-depth understanding of both disciplines, but it also showcases a comprehensive skillset to potential employers. With the increasing demand for data-driven decision-making, having a Tableau data science certification can open doors to exciting and lucrative career opportunities. Ultimately, the combination of Tableau and data science is a powerful tool for businesses and individuals alike, allowing for a better understanding and utilization of data in the decision-making process.
Real-World Examples of Tableau & Data Science Integration
Tableau and data science are two integral components of modern business operations. With the increasing prevalence of data, it's essential for organizations to streamline their processes by incorporating data visualization tools and predictive analytics. One of the most successful examples of Tableau and data science integration is the use of Predictive analytics for sales analysis and forecasting. By leveraging and empowering your employees with knowledge of Tableau data science by enrolling them in the Brainmeasures course and certification program, businesses can run predictive analytics and machine learning models against a variety of data sources, which allows them to anticipate customer demands easily. As a result, organizations can adjust their sales strategies accordingly, leading to increased revenues and more efficient operations. Overall, the integration of Tableau and data science is a game-changer for modern businesses, enabling them to stay ahead of the competition in the ever-evolving digital landscape.
Tableau has become an essential tool for data scientists because of its ability to visualize large datasets effectively. One great example of its usefulness is in analyzing time series data. With Tableau, users can easily plot data over time and uncover patterns or trends that may not be immediately apparent when looking at raw data. By creating interactive visualizations, data scientists can communicate their findings to stakeholders in a clear and concise manner. These visualizations can be customized to suit the specific needs of each project, making it a versatile tool for data analysis. With Tableau, data scientists can quickly identify actionable insights from large datasets, allowing them to make informed decisions that drive business value. In summary, Tableau is an indispensable tool for any data scientist looking to extract insights from complex datasets, especially when it comes to analyzing time series data.
Also, it is important to note that data science plays a crucial role in the success of Tableau and its effectiveness in creating personalized customer experiences. As businesses continue to collect and analyze data, they need the tools and expertise to turn that data into valuable insights. This is where data science comes in - as the field that brings together statistical analysis, machine learning, and predictive modeling to help businesses make informed decisions. By leveraging Tableau and data science together, businesses can gain deeper insights into customer behavior and preferences, leading to more meaningful interactions and increased engagement. As technology continues to evolve, it is clear that Tableau and data science will remain essential tools for businesses looking to stay competitive in the ever-changing business landscape.
Benefits of Integrating Tableau & Data Science
Integrating Tableau with data science provides businesses with numerous benefits that can enable them to make more informed decisions. By combining data from different sources, they can gain new perspectives on their operations, identify critical trends, and recognize previously untapped opportunities. Tableau's powerful data visualization and analysis capabilities, when combined with data science methods, also allow businesses to make predictions and forecasts, allowing them to plan future strategies with greater accuracy. Furthermore, with Tableau's user-friendly interface, businesses can easily extract insights from their data without the need for advanced technical skills, enabling a wider range of employees to participate in data-driven decision-making. The integration of Tableau and data science has emerged as a game-changer for many businesses, providing them with greater insights into their operations that can lead to significant improvements in efficiency, profitability, and risk management.
Thus, Tableau has become an essential tool for any data scientist looking to make sense of complex datasets. With its user-friendly interface, users can easily create powerful visualizations that enable them to quickly spot important trends and patterns in their data. Moreover, by taking advantage of Tableau’s predictive analytics capabilities, data scientists can go beyond simple descriptive statistics and uncover more nuanced insights that might otherwise be missed. For those looking to master the art of data science, Brainmeasures Tableau and data science course can provide the necessary training to make the most of this innovative tool.
By learning how to use Tableau effectively, aspiring data scientists can ensure that their analyses are accurate, reliable, and ultimately more impactful.
Who this course is for?
You should take this course if want to learn Tableau completely from scratch
You should take this course if you know some Tableau skills but want to get better
You should take this course if you are good with Tableau and want to take your skills to the next level and truly leverage the full potential of Tableau.
Prerequisites
Willingness to learn something new and basic knowledge of computers is all you need to enroll in this course.
Expected Salary
The average tableau specialist salary in the USA is $117,350 per year or $56.42 per hour.
In conclusion, the integration of Tableau with data science techniques has proven to be a powerful tool for gaining meaningful insights in a variety of industries. By combining Tableau's robust visualization capabilities with the data analytics tools provided by data science, organizations can make more informed decisions that drive business growth. From predicting customer behavior to analyzing social media trends, the possibilities are endless. If you are interested in exploring the power of data science with Tableau, then you are on the right platform, take the call to action and click on enroll now Button.
Course Syllabus
| Getting Started | 11 lectures | 17 mins |
| HTML and foundation | 11 lectures | 17 mins |
| Some title goes here | Preview | 01:42 |
| Welcome guide document | 10 Pages | |
| Some title goes here | 07:42 | |
| 2 Some title goes here | 07:42 | |
| Hello Some title goes here | 07:42 | |
| This is Some title goes here | 07:42 |
| CSS and foundation | 17 lectures | 87 mins |
| Some title goes here | Preview | 01:42 |
| Welcome guide document | 10 Pages | |
| Some title goes here | 07:42 | |
| 2 Some title goes here | 07:42 | |
| Hello Some title goes here | 07:42 | |
| This is Some title goes here | 07:42 |
| Making Responsive Website | 17 lectures | 87 mins |
| Some title goes here | Preview | 01:42 |
| Welcome guide document | 10 Pages | |
| Some title goes here | 07:42 | |
| 2 Some title goes here | 07:42 | |
| Hello Some title goes here | 07:42 | |
| This is Some title goes here | 07:42 |
| Learn Sass less Scss | 17 lectures | 87 mins |
| Some title goes here | Preview | 01:42 |
| Welcome guide document | 10 Pages | |
| Some title goes here | 07:42 | |
| 2 Some title goes here | 07:42 | |
| Hello Some title goes here | 07:42 | |
| This is Some title goes here | 07:42 |
| Learn about Cpanel and file uploads | 17 lectures | 87 mins |
| Some title goes here | Preview | 01:42 |
| Welcome guide document | 10 Pages | |
| Some title goes here | 07:42 | |
| 2 Some title goes here | 07:42 | |
| Hello Some title goes here | 07:42 | |
| This is Some title goes here | 07:42 |
Do you want this course
to learn
LIVE
?
Enroll in this course now and avail all the benefits.

Learn from industry
Experts
LIVE
?
Learn One-to-One Live Course - Coming Soon.
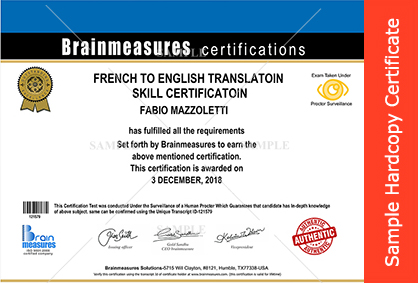


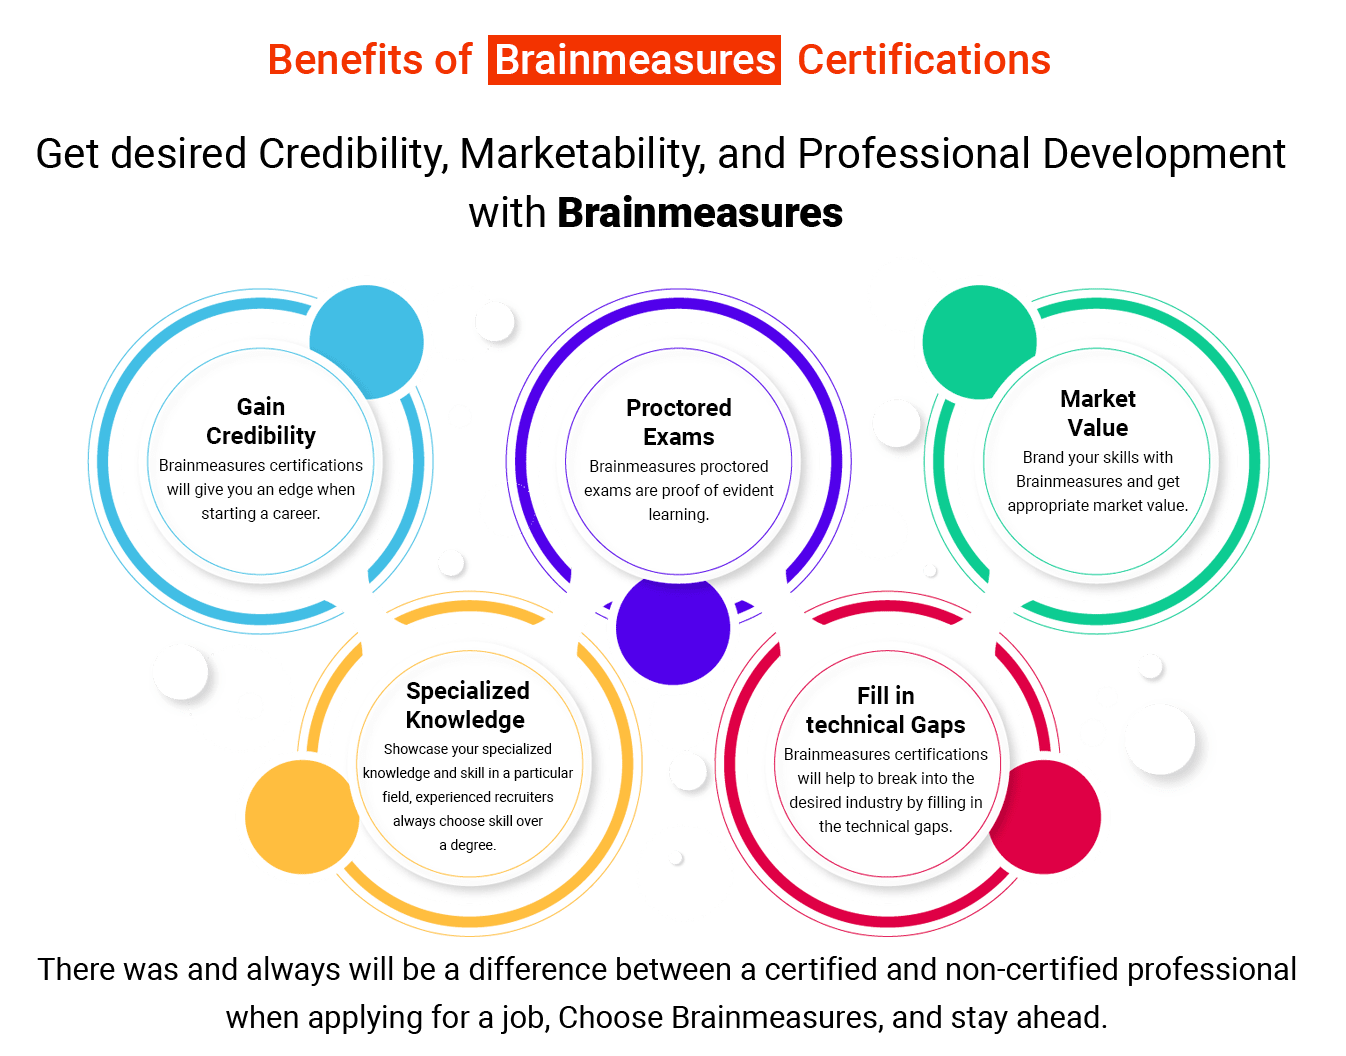
Brainmeasures Certifications are acknowledged globally because the tests are conducted under the strict vigilance of trained proctors and are recorded which makes Brainmeausres testing system the most authentic testing platform.
Enroll NowOur Hiring Partners
Brainmeasures certified Professionals work with global leaders.

Corporate Training
If you want to give the Trending technology experience to your esteemed employees, we are here to help you!
CONTACT CORPORATE CO-ORDINATOR
What makes Comprehensive Tableau I Data Science Course I Certification I Trainingunique?
VIDEO ONLINE COURSE
The video online course is well-structured and comprehensive.
EASY TO UNDERSTAND
The topics are organized in proper sequence to enable the candidate understand them easily.
SELF-EXPLANATORY
Easy to understand and implement in real life.
MORE ATTRACTIVE
Sufficient pictures, tables, graphs have been provided to make this online Course more attractive to the readers.
PROCTOR SURVELIANCE
Final certification exam conducted under surveillance of trained human proctor.
HARD COPY SHIPPED
We will ship your hard copy anywhere you ask for.
-

- We will ship your hard copy anywhere you ask for.
- SAMPLE HARDCOPY CETIFICATE
-

- Immediately after taking the test you can check your scores with detailed.
- Immediately download soft copy certificate.
- VIEW ANALYSIS REPORT
-

- ENROLL FOR Comprehensive Tableau I Data Science Course I Certification I Training - VIDEO COURSE AND CERTIFICATION PROGRAM
- REGISTER NOW
-

- Online Video course by Highly qualified Trainers.
-

- If you have any query our trainers are accessible easily.
- Send your questions and get answers within 7 working days.
-

- Final exam is proctored – you will be monitored throughout, this is done using our high-end Proctor software, so that you need not go to any special location but take it from your own PC.
- This testing format matches world-class testing standards.
- Certificate will mention wording proctored to prove the authenticity of your knowledge.
-

- You can take any number of retakes if you are not satisfied with your score or failed to pass.
- Test re-takes are paid, each retake is worth $ 50.
-

- Earn high.
- Brainmeasures certificates are honoured by employees worldwide.
- Get desired position in your organization.
TAKE A FREE TEST
Comprehensive Tableau I Data Science Course I Certification I Training
Take free practice test now
Reviews ( click here to Read all )
Why choose Us
In today’s corporate world, a single wrong decision can cost you millions; so you cannot afford to ignore any indemnities you may incur from a single wrong hiring decision. Hiring mistakes include the cost of termination, replacement, time and productivity loss while new employees settle into their new job.
Our Mission
Our Mission is simply to help you attain Course Name knowledge which is at par with best, we want to help you understand Course Name tools so that you can use them when you have to carry a Course Name project and make Course Name simple and learnable.


